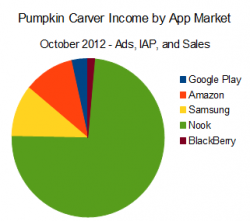
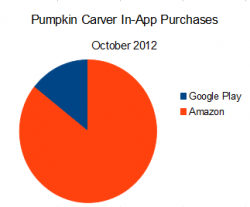
 October was a great opportunity to have a head-to-head competition between several different app markets that provide my Pumpkin Carver app for Android. I compared app sales, ad revenue, and in-app purchase revenue to get the complete picture, with surprising results!
Crunching the numbers has given me some valuable insight into where my time has been well spent, and where I should probably scale back my efforts. The results surprised me a little, even though I see the raw numbers all the time.
It’s not a factor of a few percent. I found that I’ve been spinning my wheels on some of the more difficult – but less profitable – places I could be spending my time.
I’m working on the final details now, and will send the full report out to my mailing list (the “ProjectJourneyman BrainCast”) next week. If you’re not on the list yet, sign up now in the box below!
Update – the report is out, and available to list subscribers.
The challenge
As I mentioned in my previous post, I added in-app billing to my Pumpkin Carver app, and I upgraded the paid version to make it more appealing. Then I charted the progress on various app stores over October, when Halloween should drive the most attention to the app.
Income from ads, in-app purchases, and sales can vary greatly between the different markets. Not all platforms even support all three sources of revenue. This means it takes a bit of number crunching to show the whole picture for each app store.
Crunching these numbers is time consuming, so I don’t do it for all of my apps all of the time. When I do, it provides great information to help me make decisions.
The Surprises
 I knew that Nook has been a strong performer for me, but it really outshone the rest this time. I wanted more useful information to help with my other apps though, so I kept digging.
BlackBerry has waned as a source of income this year, but Samsung has made a strong entrance.
Another very interesting result was just how well Amazon Appstore in-app purchasing performed against Google. I’ll crunch the daily conversion rates in the report too – there’s a stark difference between the two markets, and it has solidified my intent to support Amazon in-app purchases in the future.

The full details
There’s a huge pile of data beyond those few insights above, and I’m really pleased with out much information I have to work with here.
As I mentioned, I’ll be sharing (update: it’s out!) a more complete writeup and analysis of this experiment on my email list, so sign up now to be sure to receive it. I know I’ll be making decisions based on this information, and I hope it will be helpful in your planning to maximize revenue from your Android apps.

Great blog. We’d love to re-post some of your posts on our blog (blog.codengo.com). Is this something you’d be interested in?
Normally I don’t allow reposting of my material, but I’ll contact you by email to discuss further.
It is very interesting report. The world’s popular app store Google play store is not giving you the maximum income or ROI. Can you please tell me how did you analysed this and what is the criterias of your analysis.
The primary measure here was actual revenue, with a focus on app sales and In-App Purchases. As shown in the report itself, I also tracked IAP revenue per free app download on both Google Play and Amazon. ROI wasn’t calculated.